|
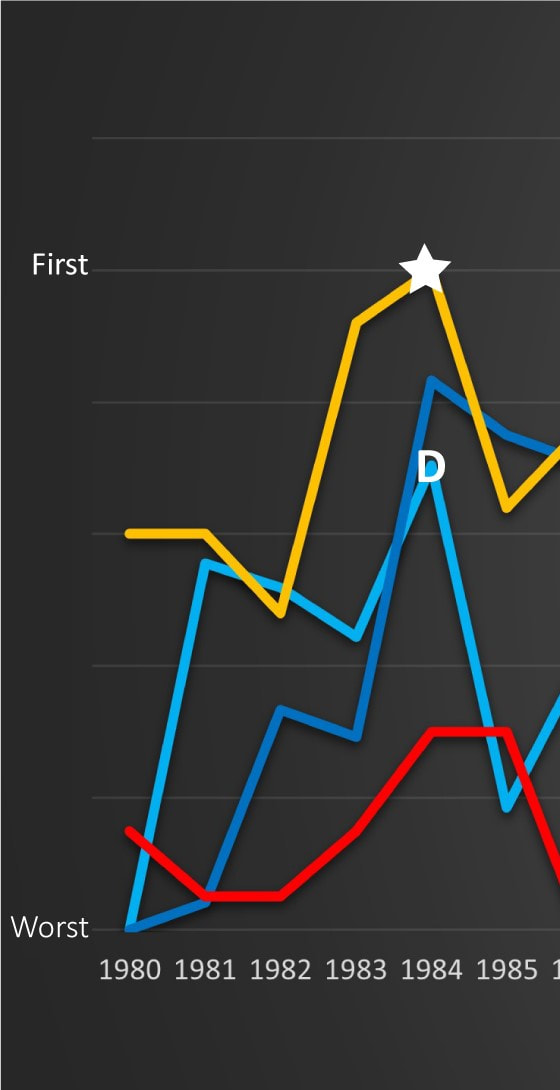
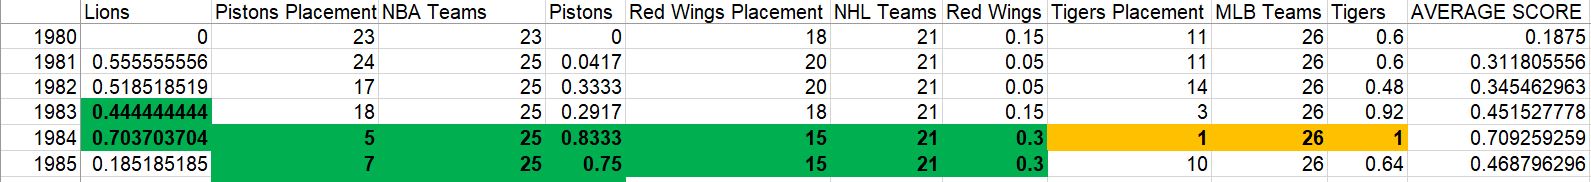
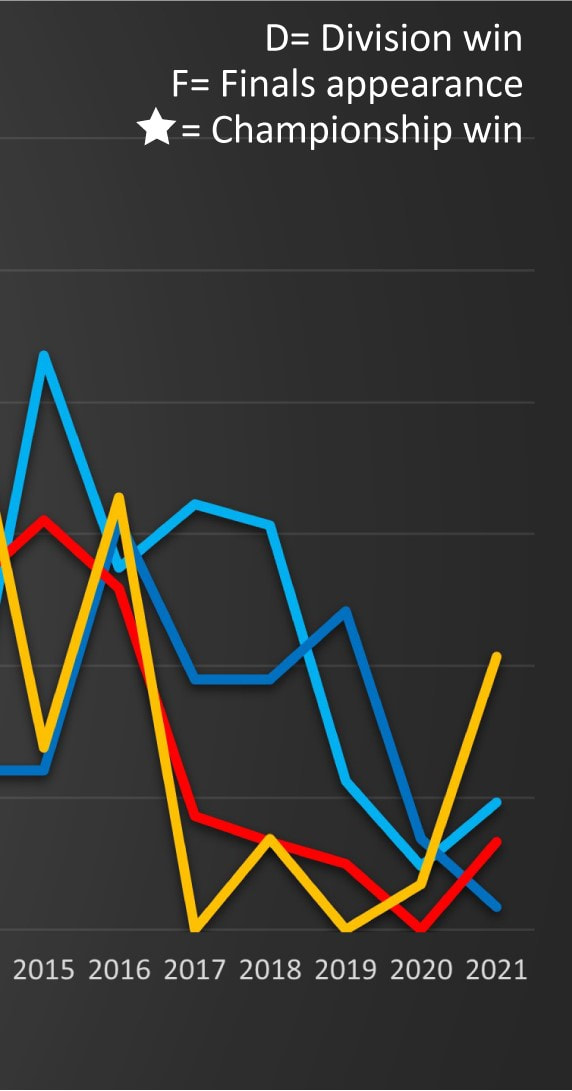
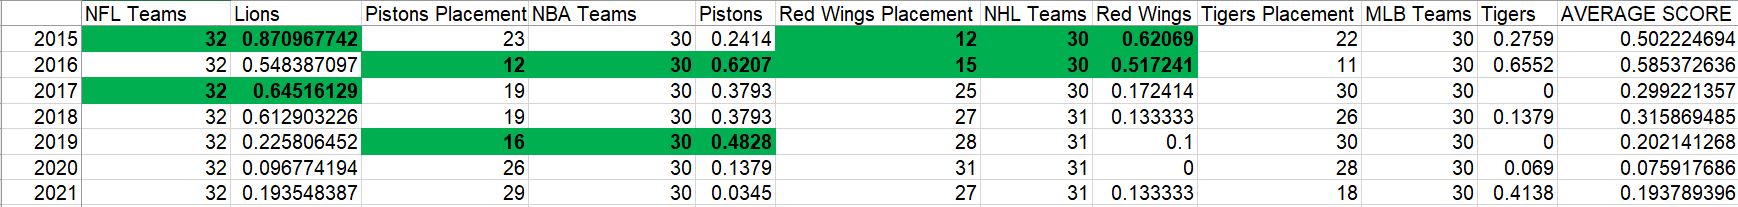
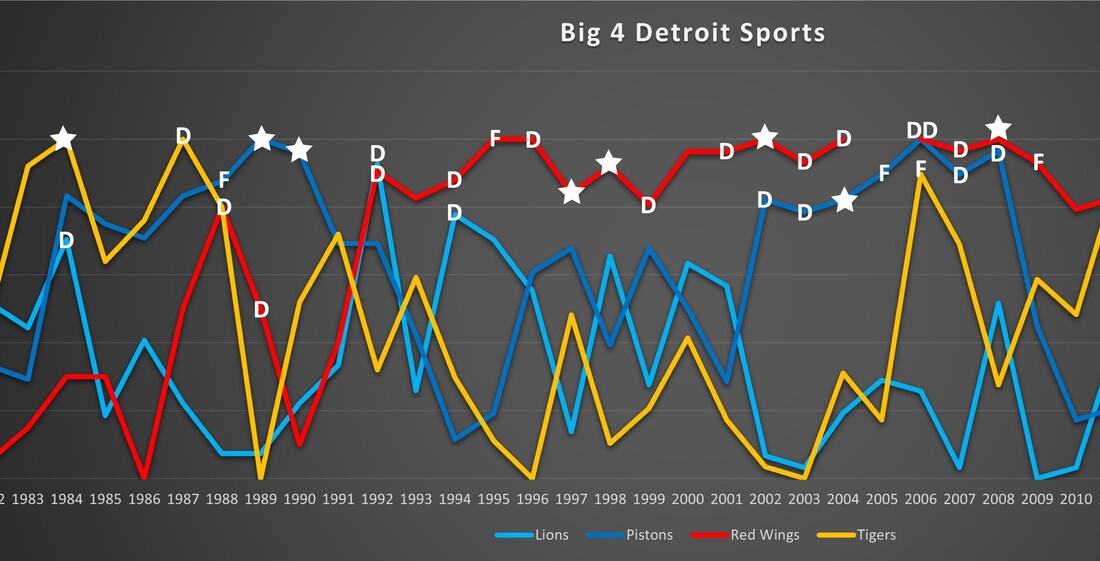
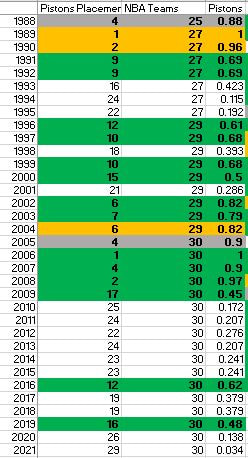
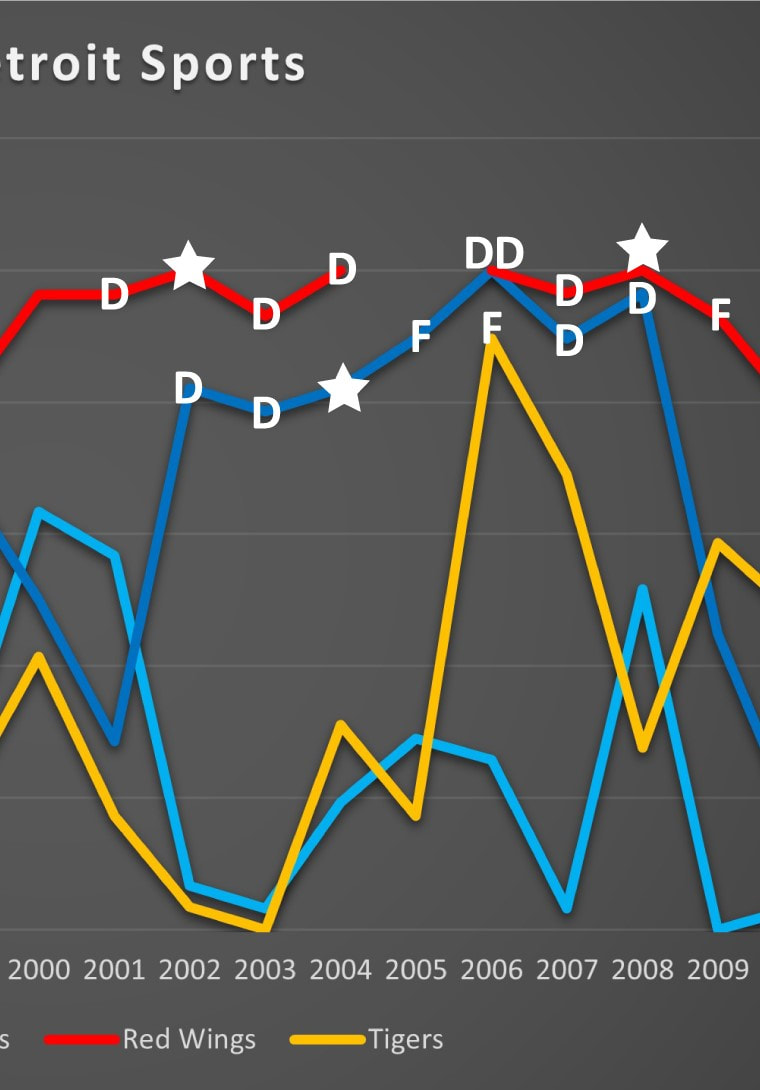
I mapped out every Big 4 Detroit Sports teams over the last 40 years based on their regular season placement relative to every other team in their league. I have to give credit for the idea to Lindsay Towne. When we were talking about how abysmal Detroit Sports are these days and wondering how it compares to past decades, we came up with this idea. This is what we found out. 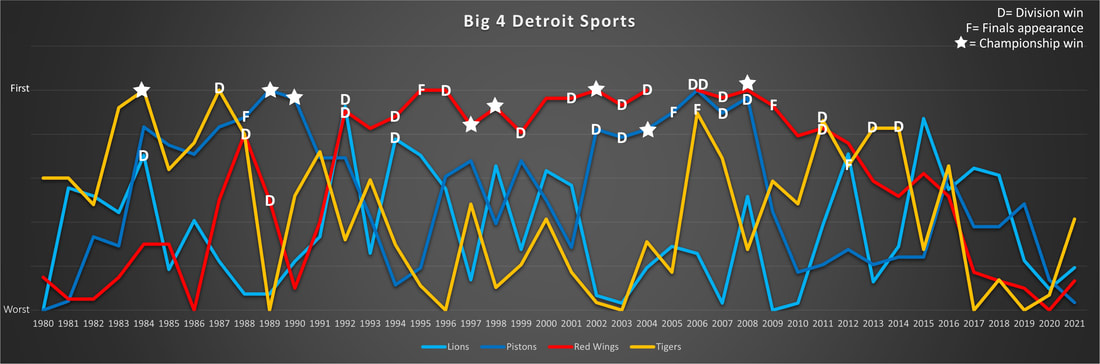 The DataI retrieved placement and number of teams by going year by year through league reference sites. The placement you see is based on regular season record. For postseason results, I have highlighed in the table (below) when a team makes the playoffs (green), makes it to the finals (silver), and wins a championship (gold). Because the NFL has a limited number of games, I used the Detroit Lions draft position as their placement, which uses tiebreakers and takes out the variability that an 8-8 team could be (for example) anywhere from 12 to 20 out of 32. I'm acknowledging right now that none of this data is perfect because of the way leagues fluctuate or become unbalanced. Still, after a lot of debate, I hold that this was the best way to do an apples-to-apples comparison across sports. This is also why I ultimately ended up only highlighting Division winners on the graph (D) instead of when a team makes the playoffs. By definition, the Tigers have to be a top 4 team in the AL while Pistons/Red Wings have to be top 8 to make the playoffs. I like what we ended up with. The final step of the data was to make a formula that got a number to represent relative placement. I used the data to calculate a number where 1.0 is the best team and 0.0 is the worst team in the league that year. A team that is 0.5 is perfectly in the middle of the league. I have the untouched table and graph below for better understanding. 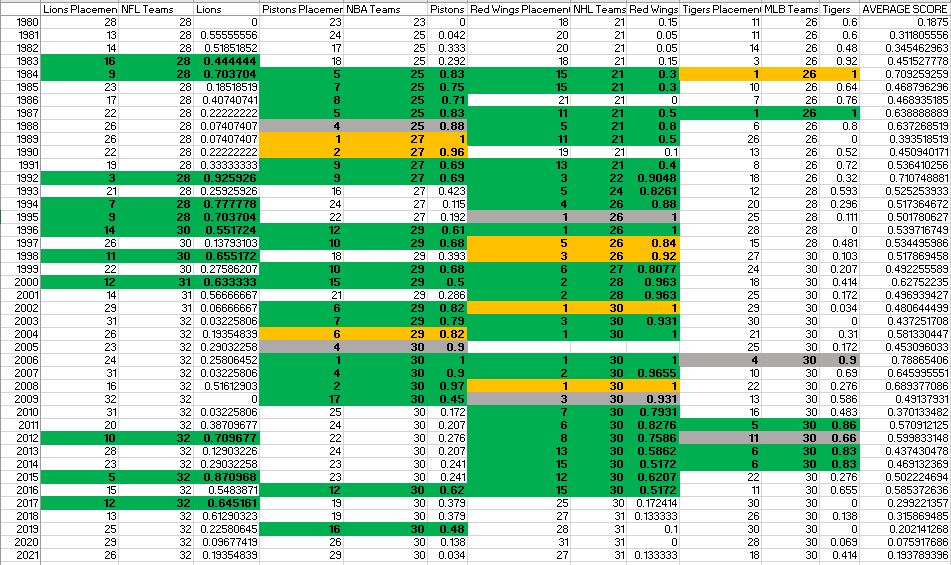 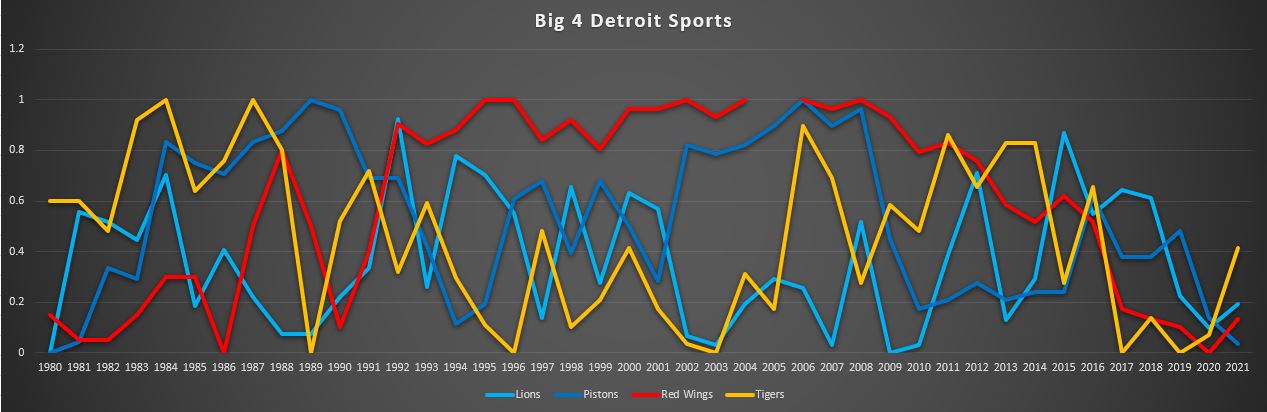 Initial HypothesisInitially, I wanted to prove that Detroit sports has been historically bad over the last 5 years (‘17-‘21). The upper right corner of this graph is nearly empty besides the ‘17 Lions (.645) and ‘18 Lions (.612). Nobody has won a division since the Tigers in ‘14. The only playoff appearances during this time frame are the '18 Pistons (8 seed, 41-41 record) and '17 Lions (6 seed, 9-7 record). ’16 is the end of the Red Wings playoff streak. Point proven. 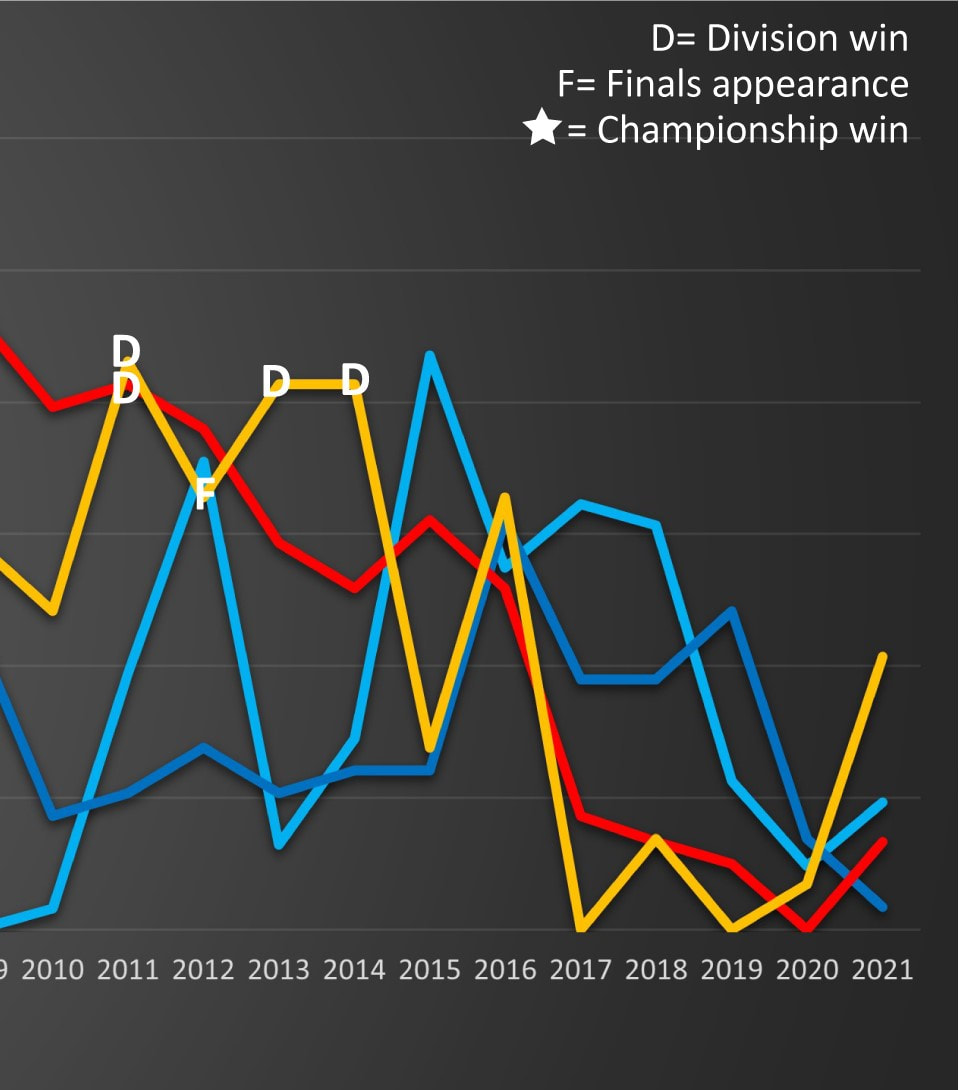 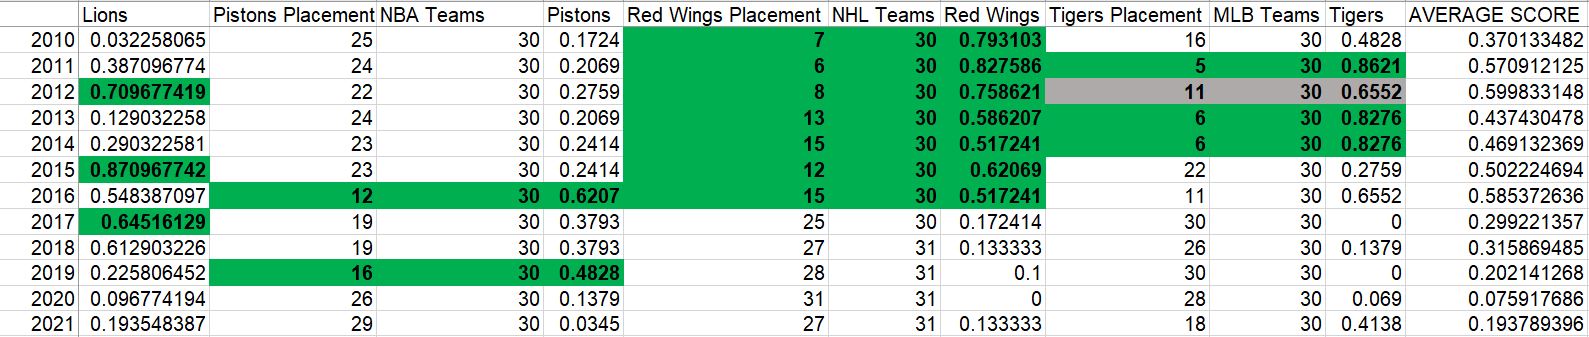 I think visually this succeeds in proving that point, and the data doesn't lie. The graph starts off at an interesting point suggesting Detroit Sports haven’t been this bad since 1980 exactly. The average score between the 4 teams in 2020 was the lowest ever (.076). Other than 2020, their average score in 2021 (0.194) was the lowest since 1980 (0.188).
LionsAre the Detroit Lions the best Detroit team of the last decade? The data says yes, as their average number is the highest of the 4 from '12-'21. This is a little deceptive because their number is still below average at .432. If the question is the best Detroit teams of the 2010’s (2010-2019), it would still be 1) Red Wings .502 2) Tigers .472 3) Lions 0.445. The Detroit Lions have only 3 division wins, but it is a little deceptive because they have 11 playoff appearances, most recently in ‘12, ‘15, and ‘17. Their last playoff win was in 1992. My favorite point about the Detroit Lions is that THIS is the point they decided to fire Jim Caldwell for going 9-7 for the second year in a row but not making the playoffs. 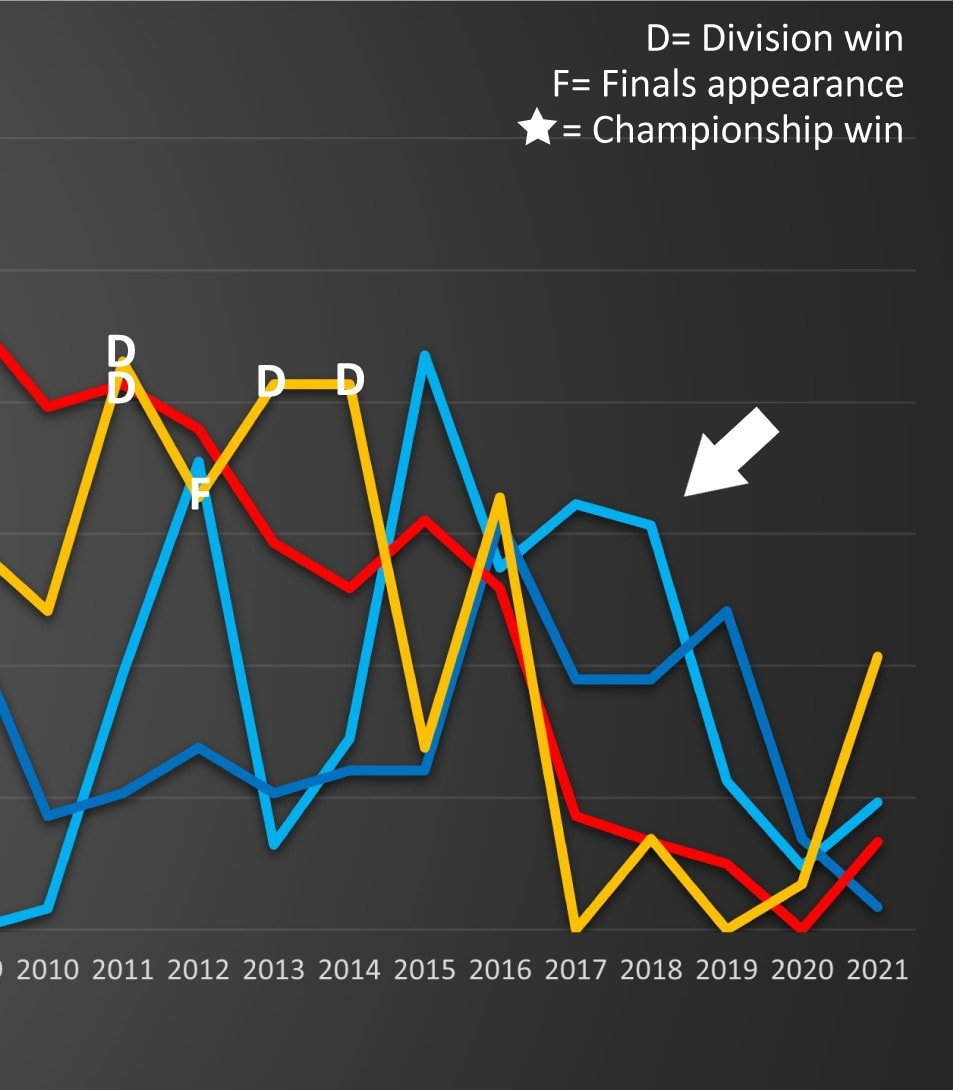 PistonsThe Detroit Pistons have 2 great runs when they make the playoffs every year and win at least one championship, ‘84-‘92 and ‘02-‘08. Weirdly, both of those runs are characterized by fast rises and falls.
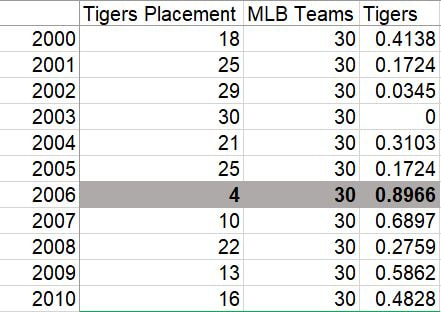
Red WingsI challenge anyone to find a team in sports that mapped out in this way looks anything like the Red Wings during their playoff streak (1991-2016). If the 2005 NHL season wasn’t a lockout, there is no reason to believe the Red Wings wouldn’t have been the number 1 team in the NHL from 2004-2006. The biggest surprise is that they didn’t win MORE Stanley Cups. 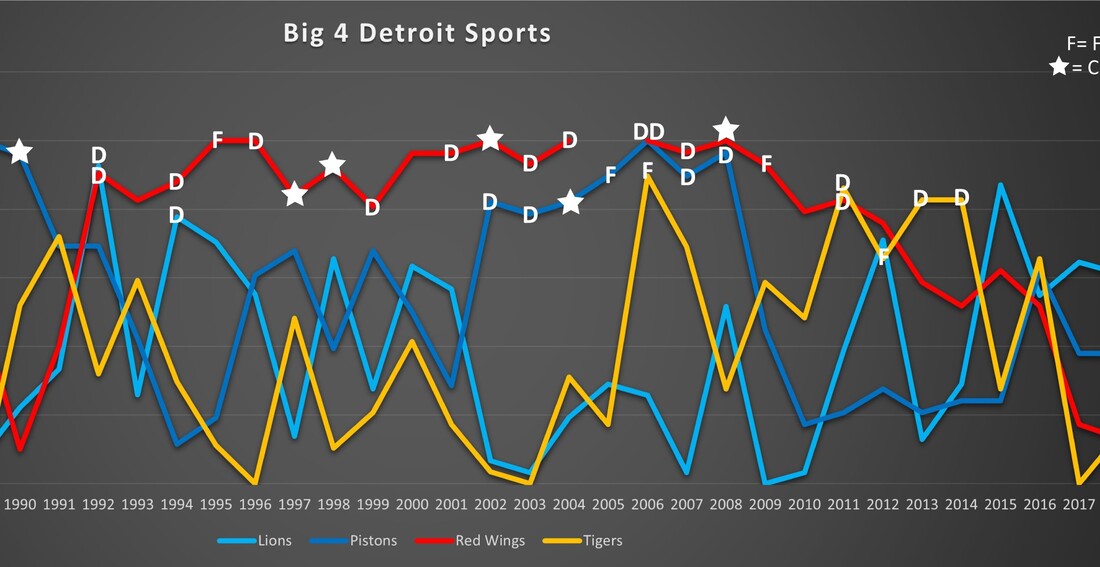 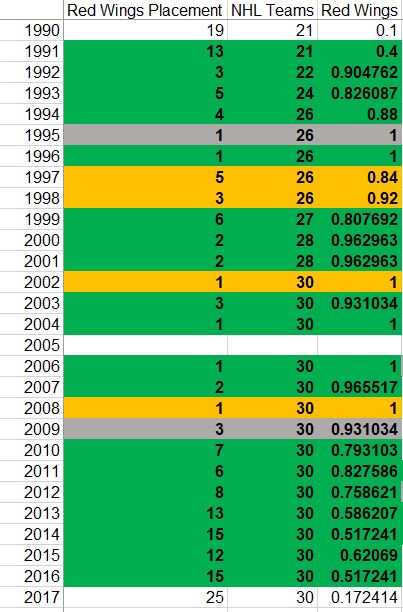 TigersThe ‘06 Tigers are an anomaly. While the best in the league ‘06 Pistons and Red Wings didn’t make it to the finals, the 4th in the MLB 3rd in the AL Tigers made it to the World Series. There’s nothing to suggest in 01-05 that the team is promising, and they don’t make the playoffs in ‘07.
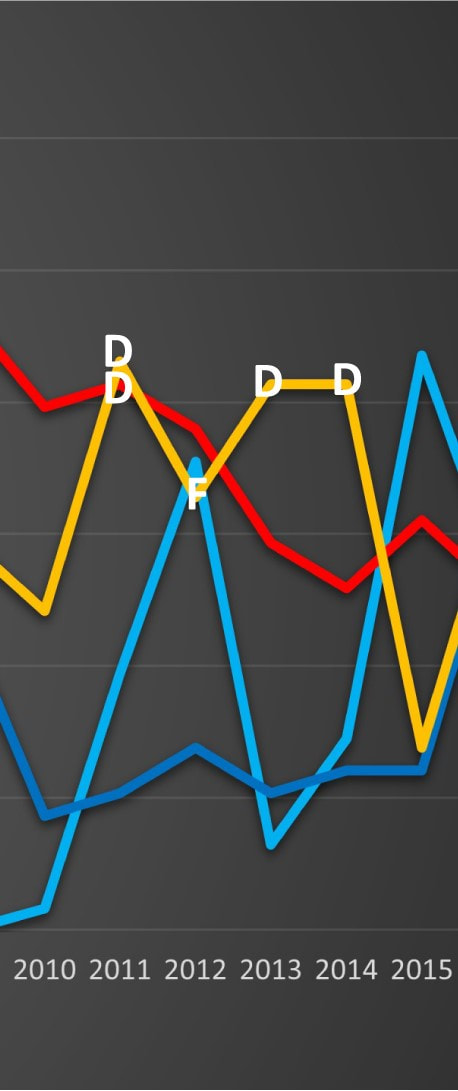
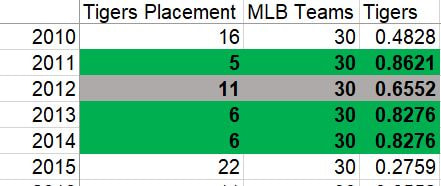
Below is the stretch where everyone said the Tigers should have won a world series. While the talent is undeniable, the data actually suggests it’s not surprising they didn’t win. Even thought they won their division every year, there are consistently 4 teams that are performing better than them in 162 games. It’s most surprising that the year they made it to the World Series was 2012 (11th place, 88-74 record).
Final takeawaysI'm ultimately really glad I put this much time into this project. The graph is really cool, but the table is a tool that I'm going to use going forward to compare teams across sports and time.
One of the coolest things about this graph is that you can see how fast a bad team can get better. You see a team place last, draft a Barry Sanders, Steve Yzerman, or Matthew Stafford, and instantly become a winner. That's one of the greatest stories in sports, and I think Kurt Vonnegut would agree with this way of mapping it out. And my absolute biggest takeaway: sometimes, shit just doesn’t make sense. Teams fluctuate a lot more than I expected them too, and rises and falls are so fast, predicting when a team gets good would be almost impossible. Sometimes, a division winner is middle of the league, and sometimes a champion doesn’t win their division. Sports is weird, but that’s why we love it. Respond with comments and questions, and I’ll try to get back to them!
0 Comments
Leave a Reply. |